lab_7
Volumetric analysis and Intercomparison
Introduction:
We have been learning how to fly the UAS and implementing the acquired data to make some outcomes. The outcome such as accurate map, is importance but also knowing the application is important. Measuring the volume of sediment in the construction areas and mines is not a new technology. There are methods that measure the volume of such sediments for example, plane Lidar and total stations. However, those are sort of hard to manipulate and expensive for the no professional people. Fortunately, the technology has been developing and UAS can now take over this needs. It is much faster and cheaper. It provides you high quality of 3D map, but further more, allows us to calculate the volume of certain resources. Therefore, we can see the change detection which tells us how much of resources were mined. This is very essential for the running the quarry because, as much as accuracy of volumetric measurement we can get, our efficiency and profit of the business will be increased. In this lab exercise, we are going to use quarry data set and measure volume of sediment and compare with the volume measurements such as DSM and TIN from the Arc Map.
Study Area:

Figure 1. Study Area map: La Crescent Mine, MN
Volume calculation methodology:
In this exercise, we are going to measure the volume from three different methods. We will calculate one in the Pix4D and open the Arc Map, use the DSM that we have generated, and calculate the volume in the Arc Map tool. Additionally, we are also going to calculate the polygon volume from the TIN method in the Arc Map.
First, we open the Pix4D, go to the volume section, and find the resource sediment that you want to measure. Digitize the sediment boundary as precise as possible, this is because, more vertex points you digitize, you will get higher accuracy of the volume.


Figure 3. Stockpile 2

Figure 4. Stockpile 3
Now, we are going to calculate the volume of the DSM and TIN from the Arc Map.
First, you need to export the vector format of your digitized file.

Figure 5. Export as shapefile
Open the Arc Map and import the DSM file that you have made in previous lab. Import the shapefile that you just created.

Figure 6. DSM & Shapefile
In the toolbox, find the tool that says "Extract by mask". This will mask out your DSM by the shapefile you made.


Figure 7. Extract by Mask tool
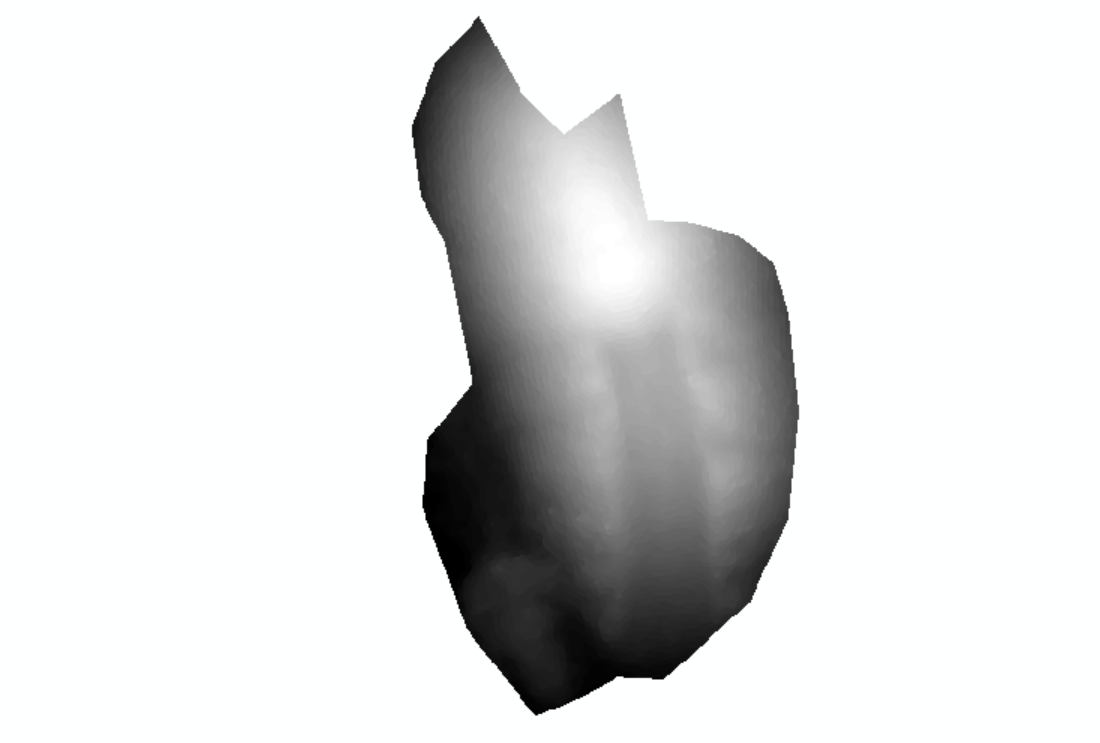
Figure 8. DSM of mask
Now, you can find the volume of the masked DSM file by "Surface Volume" tool. Make sure measure the above the ground and its value, you can either use identify button or read the scale.

Figure 9. Surface Volume tool

Figure 10. Volume of DSM
Now, you need to find the volume of the TIN, which is vector polygon file. TIN stands for "Triangular irregular networks". It is the vector based digital geographic data and is constructed by triangulating a set of vertices. Those vertices are connected with the edges to make a network.
First, you need to use "Raster to TIN" tool in the tool box.

Figure 11. Raster to TIN tool
TIN itself doesn't have a information in it therefore, you need to use "Add Surface Information" tool to add the "zMin" ad "zMean" information to the vector shapefile.

Figure 12. Add surface information tool
Once you added the surface information, you are going to find the volume of the polygon by using "Polygon volume" tool.

Figure 13. Polygon Volume tool

Figure 14. Volume of TIN
Figure 15. Volume calculations of each different methods

Figure 9. Surface Volume tool

Figure 10. Volume of DSM
Now, you need to find the volume of the TIN, which is vector polygon file. TIN stands for "Triangular irregular networks". It is the vector based digital geographic data and is constructed by triangulating a set of vertices. Those vertices are connected with the edges to make a network.
First, you need to use "Raster to TIN" tool in the tool box.

Figure 11. Raster to TIN tool
TIN itself doesn't have a information in it therefore, you need to use "Add Surface Information" tool to add the "zMin" ad "zMean" information to the vector shapefile.

Figure 12. Add surface information tool
Once you added the surface information, you are going to find the volume of the polygon by using "Polygon volume" tool.

Figure 13. Polygon Volume tool

Figure 14. Volume of TIN
Result:
|
|
Pix4D
|
DSM/Arc Map
|
TIN/ Arc Map
|
|
Stockpile1
|
70984.62
|
91409.15
|
92531.9
|
|
Stockpile2
|
15145.02
|
35151.39
|
34966.48
|
|
Stockpile3
|
103858.37
|
229691.02
|
231696.61
|
Figure 15. Volume calculations of each different methods
Discussion:
According to the results, volume calculation of Pix4D has smallest value whereas volume of DSM and TIN are similar. We can't comfortably say which method is the most accurate, however, we can assume that Pix4D is the preferably picked. We say that with the assumption that we precisely digitized the boundary. It is the 3D and based on more reliable terrain application.Conclusion:
In conclusion, Pix4D method was the most accurate approach. This is because in Pix4D, we had lots of the key points to make a point cloud. As I mention in discussion, Pix4D takes account the irregular shape of the terrain, whereas DSM and TIN are based on the flat surface.
According to this lab exercise, we were able to compare the 3 different methods to find the volume of the sediments. We are now able to decide which method is more appropriate to use and what are the advantages and weakness. Three different methods can be used depends on your needs.
We all can expect that there will be more efficient method in many other variety of software.
Comments
Post a Comment