lab_9
Multi-spectral data collection and analysis to create vegetation index map
Introduction:
Photo, picture and different kinds of images are now essentially used in our life. People like to take a picture and share it with others. However, not many people know how the images was taken from inside of camera. Most of the cameras contain RGB bands stands for Red, Green and Blue. These are the standard bands that have been applied to generate the color image. If you are very interested in how this images were created, you should know there are many other bands that could be used in different purpose. In this lab, we are going to use two extra bands which are NIR(Near infrared) and Red Edge, to create a vegetation index map by using RedEdge M camera.

Figure 1. Red Edge M camera from Micasense
NIR, Red and Red edge are the most important bands for vegetation analysis because, the NDVI (Normalized Difference Vegetation Index) which represents the occurrence of vegetation, can be calculated by those bands.

Figure 2. NDVI formula
The value from the NDVI will indicates you how much this place in the image is vegetated. High value indicates there is a green vegetation. However, we better understand how these bands are working by reflectance. According to the reflectance profile, this will show you visual information that how the pixel of image shows you different wavelength based on the reluctance in different bands.

Figure 3. Spectral profile

Figure 3. Spectral profile
According to the Figure 3. , the green line in the graph represents the agriculture which is vegetation. As you can see, it is low at the red band and increases spontaneously at the NIR band. This happens because, biologically, pant observes the red wavelength and reflects the NIR. Now, you might wonder then, what is Red edge and how does this work. Red edge is located at between Red and NIR.
Red edge captures the narrow bands between Red and NIR. Therefore, it enables us to see the small differences within the band. This helps people to differentiate different types of vegetation. Basically, it is very good band for vegetation.

Figure 4. Difference between modified and narrow band multi-spectral cameras
In this lab, images had been taken by Red Edge M which is very sufficient camera for analysis of vegetation. We will generate NDVI map to see whether or not there are some vegetation in our study area. Additionally this NDVI map that we are going to produce, is very essential and helpful to farmer and land analyst. They can decide where to grow and study by just looking at the NDVI values.
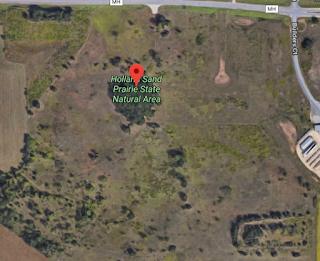
Figure 5. Holland Sand Prairie, Holmen, WI

As a shown above, the Pix4D mapper software couldn't process the other part of the study area. Therefore, we have deiced to subset our processing area. In this particular lab, we need to do something that we haven't done before. We are dealing with band and reflectance, therefore we need to calibrate our reflectance.

Figure 8. Processing option for Index calculation
we have to calibrate the reflectance by using reflectance calibration panel.

Figure 9. Reflectance calibration Panel
We need to use this panel to calculate accurate reflectance corresponding to all the bands. This should be used because, we don't know and can't find super accurate reflectance when we are in outside. There are many obstacles such as weather. This measured reflectance will allow you to calibrate your reflectance and produce good NDVI.
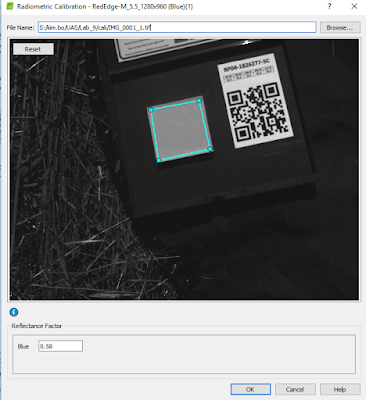
Figure 10. calibrating reflectance
Digitize along the box line and make sure remain the little gap between the line and square line. write down the given value in the band box. Once you are done with calibrating, you may run the process.


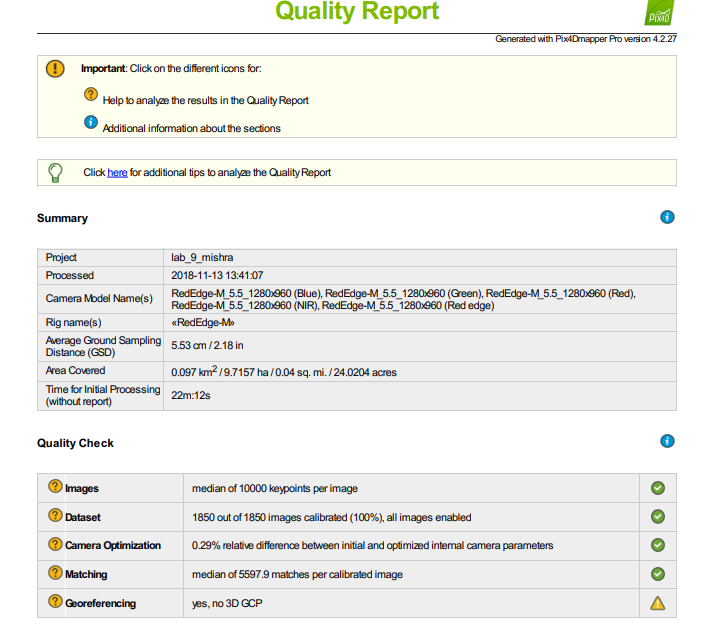
Figure 11. Quality report and Geolocation Accuracy.
 Figure 12. NDVI map
Study Area:

Data collection and Methodology:
In this map, we use VTOL type of UAS called BirdsEye View Firefly 6 Pro. For the payload, we used Micasense Red Edge M camera which contains bands with RGB, Red, Red Edge and NIR.

Figure 6. BirdsEyeView Firefly 6 Pro
Same as what we did in previous lab, we had GCPs to improve quality of outputs.


Figure 7. Processing area with subset area
As a shown above, the Pix4D mapper software couldn't process the other part of the study area. Therefore, we have deiced to subset our processing area. In this particular lab, we need to do something that we haven't done before. We are dealing with band and reflectance, therefore we need to calibrate our reflectance.

Figure 8. Processing option for Index calculation
we have to calibrate the reflectance by using reflectance calibration panel.

Figure 9. Reflectance calibration Panel
We need to use this panel to calculate accurate reflectance corresponding to all the bands. This should be used because, we don't know and can't find super accurate reflectance when we are in outside. There are many obstacles such as weather. This measured reflectance will allow you to calibrate your reflectance and produce good NDVI.

Figure 10. calibrating reflectance
Digitize along the box line and make sure remain the little gap between the line and square line. write down the given value in the band box. Once you are done with calibrating, you may run the process.
Results:


Conclusion:
According to the results, we were able to create good NDVI map. In the map, the red indicates high NDVI value which is more vegetation. I'm assuming that this kind of result will be very helpful to the people who want identify vegetation growth in the prairie. More over, we can have NDVI map in different time series and compare the images to see the growth and loss of the vegetation. I highly expect to see people who learned this map making skill and apply for different kinds of needs.
Comments
Post a Comment